Solar Plant Project Control Dashboard: Indicators and How to Implement It
Building a solar plant involves design, procurement, civil works, installation and commissioning, usually with several contractors. A project control dashboard brings progress, cost, procurement and safety into one view so that delays are seen early.
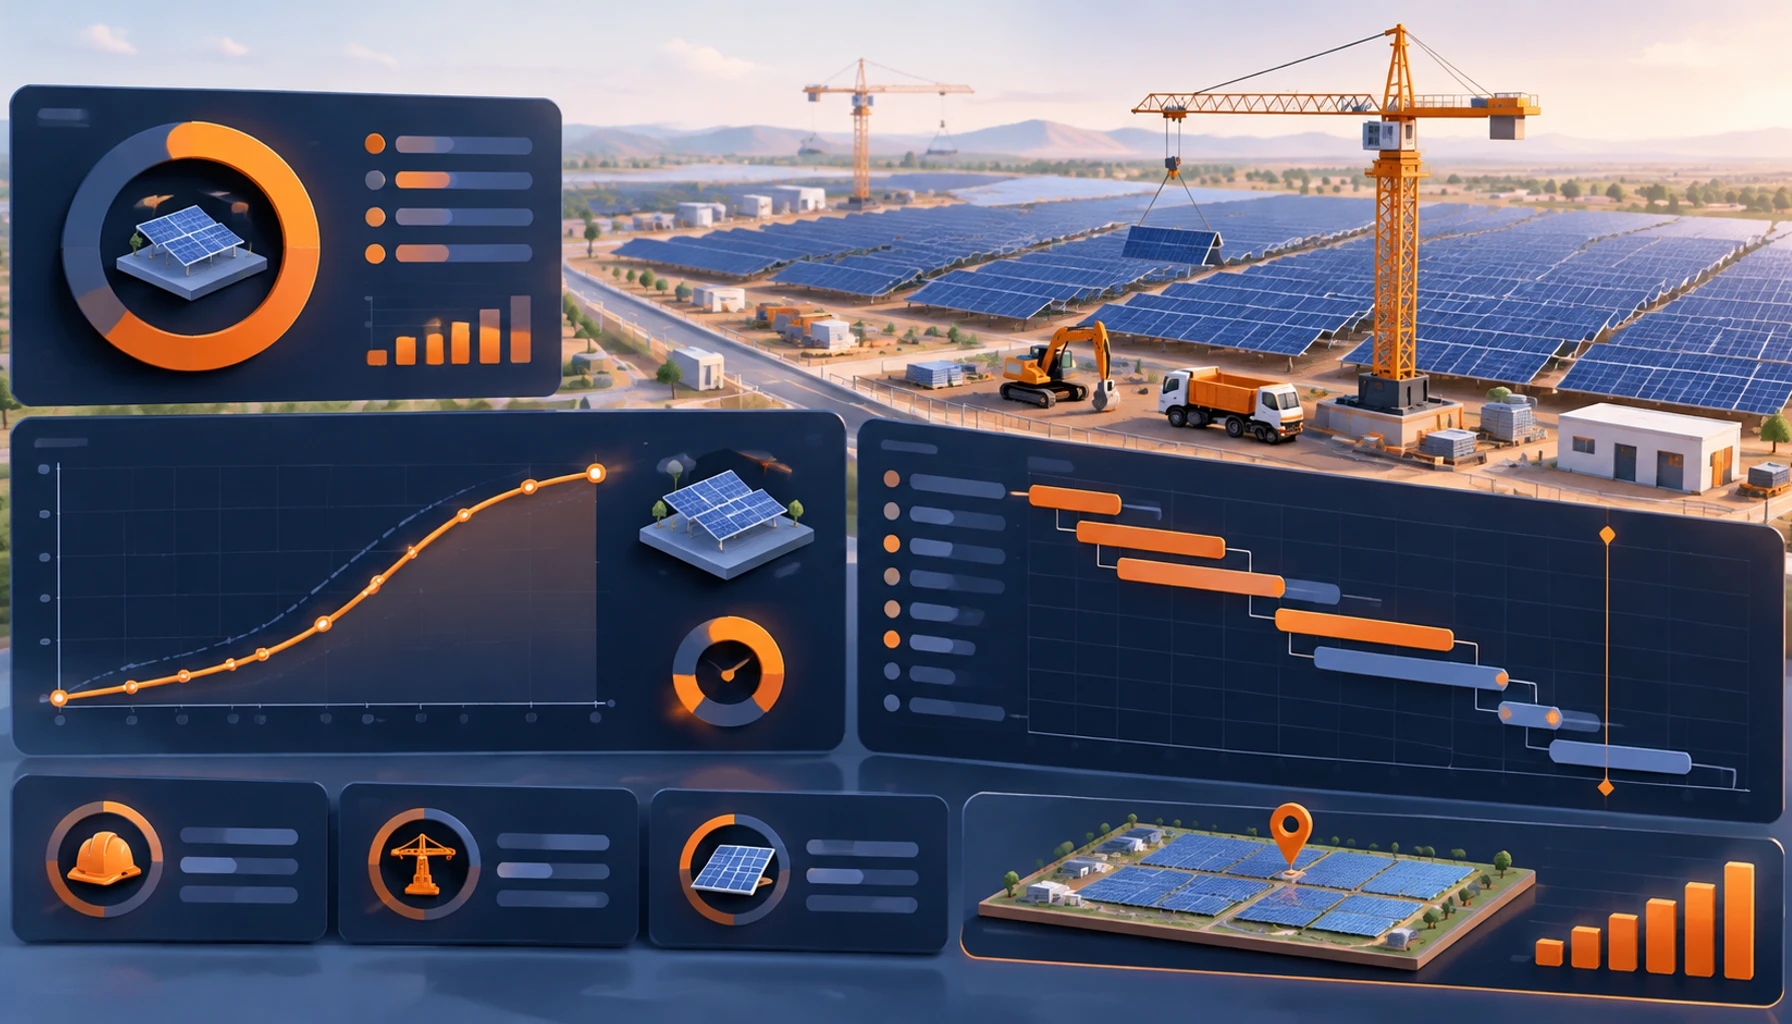
Why solar projects need a dedicated dashboard
Delays in one package, such as late delivery of modules or inverters, can hold up the whole plant. When progress is reported in separate files by separate contractors, the project manager sees problems late. A dashboard collects them in one place.
Core indicators
- Planned versus actual progress: overall and per work package.
- S-curve: cumulative planned and actual progress over time.
- SPI (Schedule Performance Index): earned value divided by planned value; below 1 means behind schedule.
- CPI (Cost Performance Index): earned value divided by actual cost; below 1 means over budget.
- Procurement and delivery status: modules, inverters, structures, cables and transformers.
- HSE indicators: incidents, near-misses, inspections and open actions.
How it is implemented
- Agree the work breakdown structure and the baseline schedule.
- Define how progress is measured for each package.
- Collect weekly or daily site reports in a standard format.
- Connect the data to the dashboard and set alerts for late items.
- Review it in the weekly project meeting.

Practical tips
- Use the same progress rules for every contractor.
- Track long-lead equipment separately; it is often the critical path.
- Show the next two weeks of planned activities, not only history.
Summary
A solar project control dashboard helps the project team see delays and cost overruns while there is still time to act. Its value depends on consistent progress data from the site.
Tell us what you need and we will review the best way to build it together.
Call: +98 930 170 2710 WhatsApp Telegram