Factory Energy Dashboard: Control Electricity and Gas Costs by Monitoring Consumption
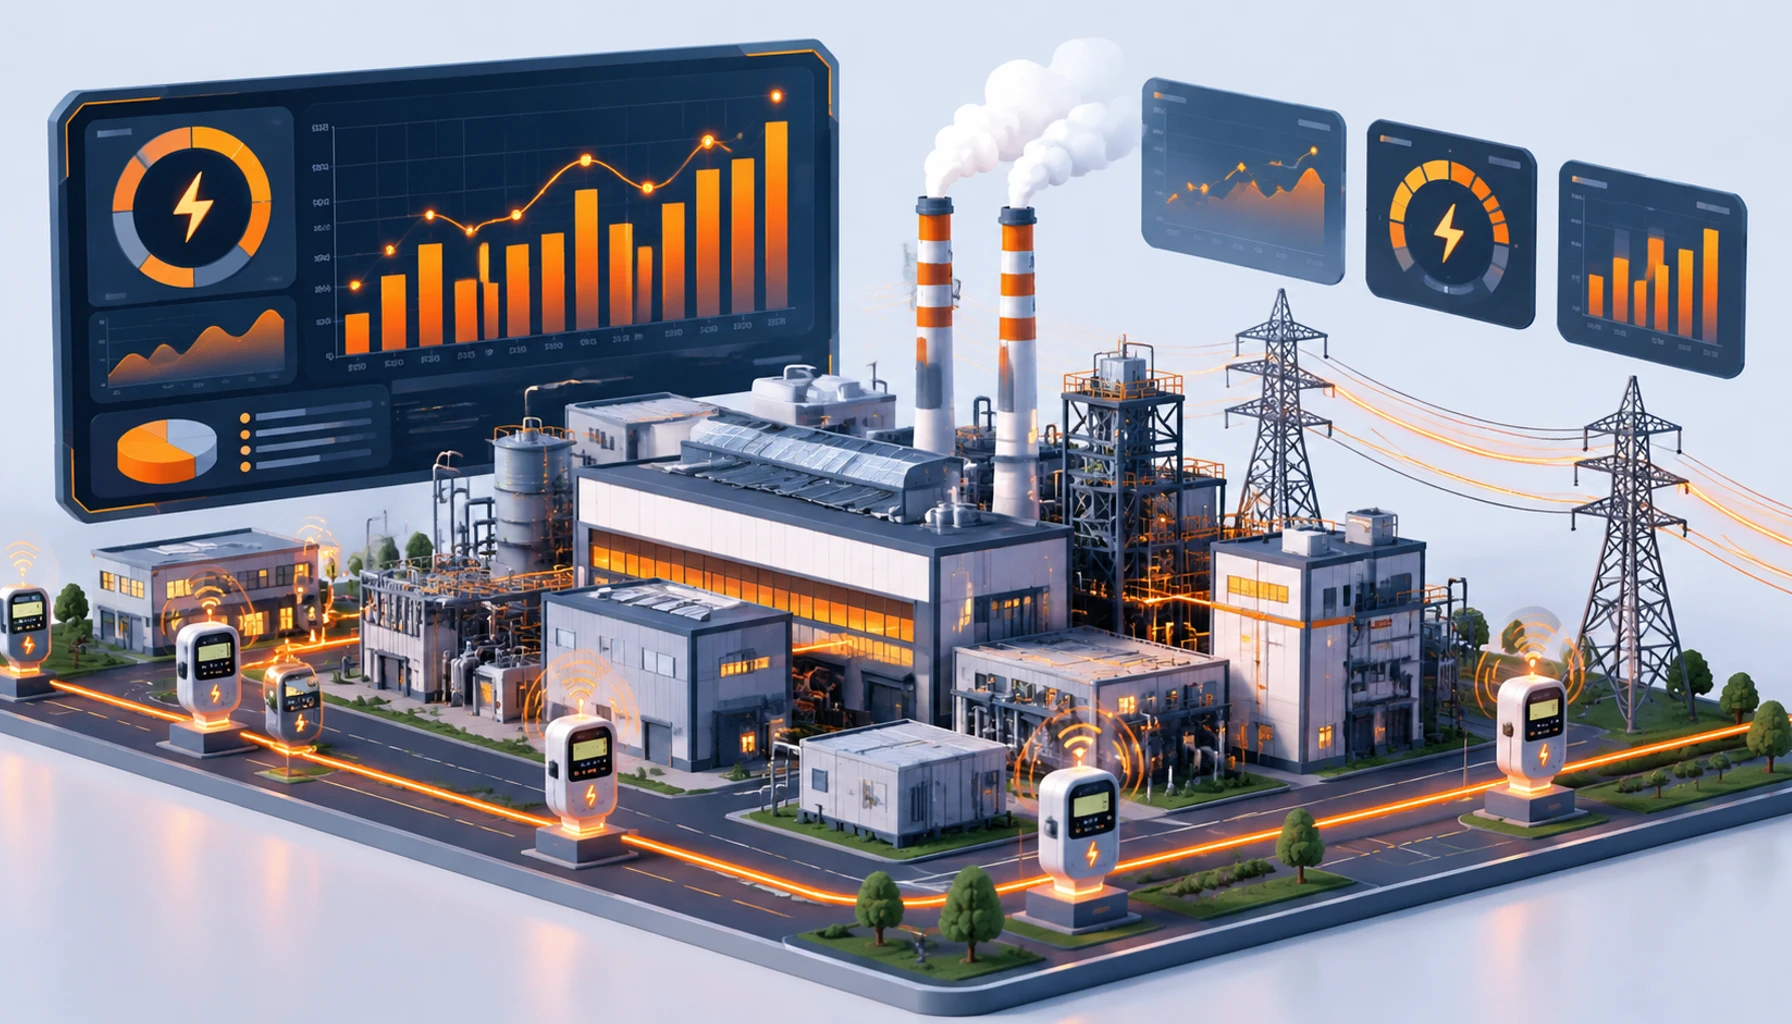
For many factories energy is one of the largest costs, yet it is often seen only on the monthly bill. An energy dashboard breaks consumption down by line and by time so waste becomes visible.
Why monthly bills are not enough
A bill gives one total for the month. It does not tell you which line, shift or machine used the energy, or whether consumption rose because production rose. Metering at the right points and showing the data in a dashboard answers those questions.
What to monitor
- Electricity consumption and maximum demand
- Power factor
- Consumption by tariff period (peak, mid-load, low-load)
- Gas, water and compressed air per production line
- Energy intensity: energy used per unit produced (kWh per unit)
From data to action
- Install or read meters at main incomers and major loads.
- Link consumption with production data.
- Set a baseline for each line.
- Alert when consumption departs from the baseline, for example machines left running outside production.
- Review monthly and record the actions taken.
Limits to keep in mind
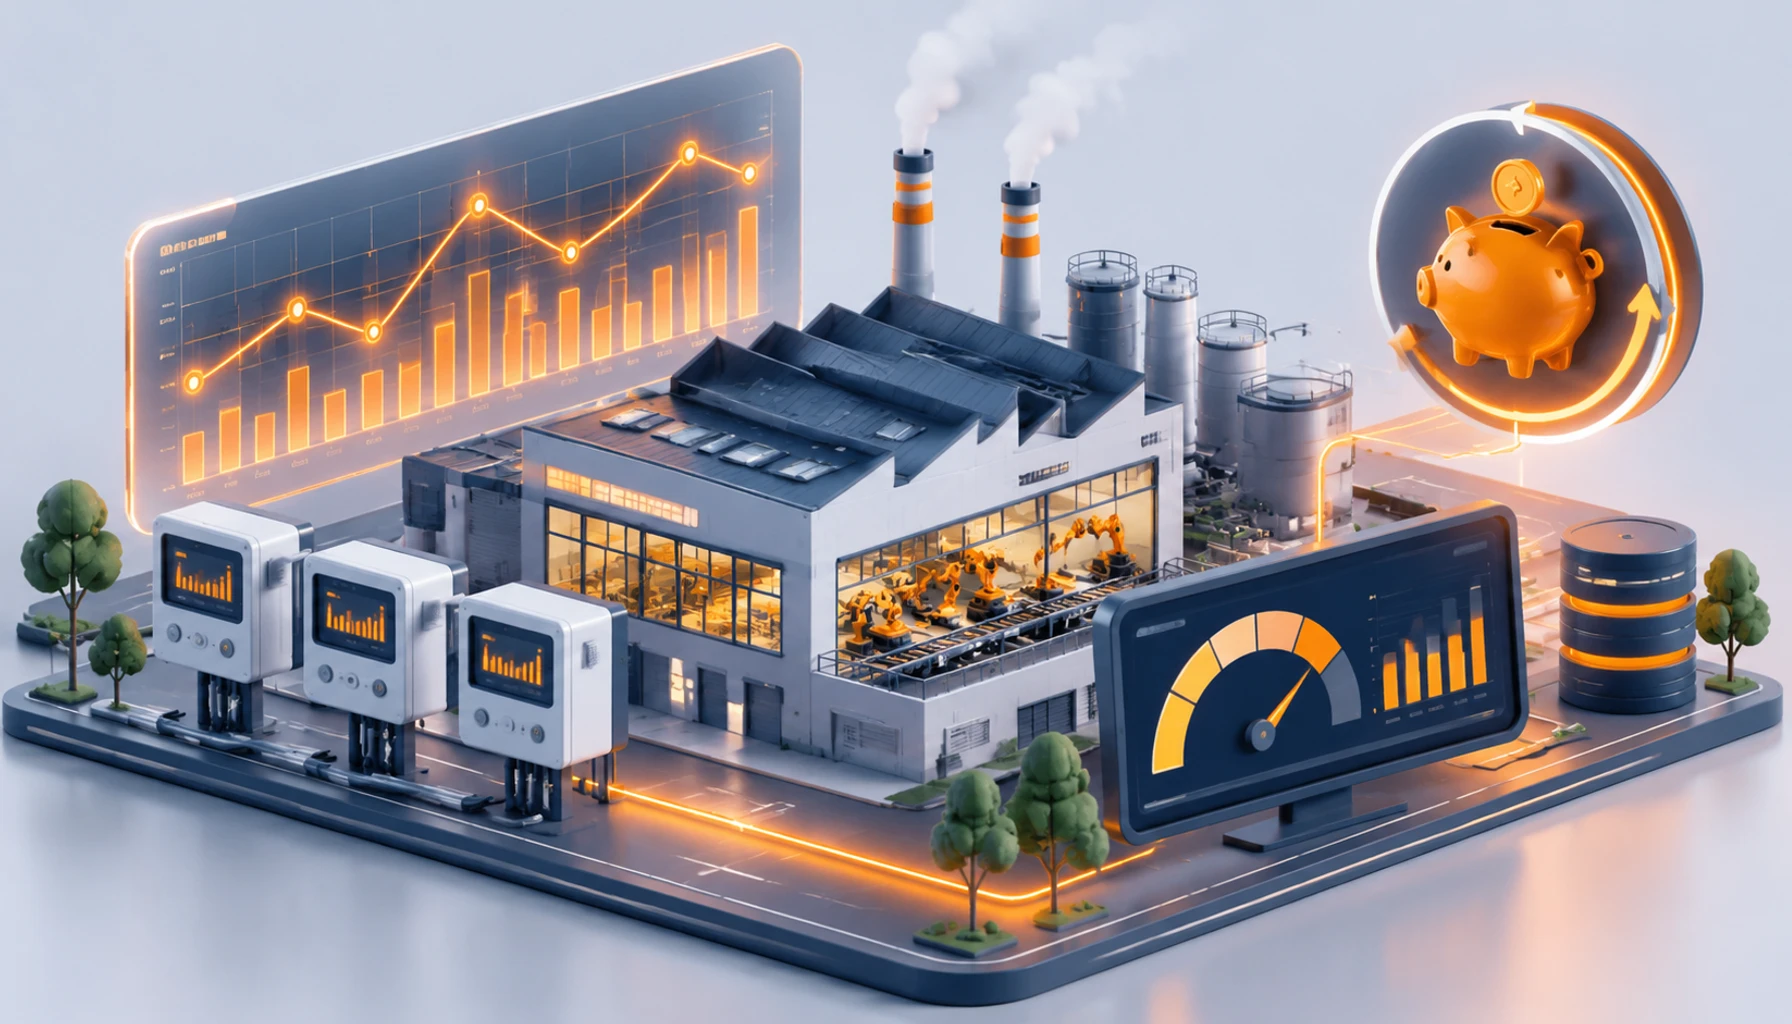
The dashboard shows where energy goes; savings come from the actions taken afterwards, such as scheduling, maintenance and equipment changes. The achievable saving depends on the plant, so we do not promise a fixed percentage.
Summary
An energy dashboard gives factory managers a daily view of consumption by line and time, which is the starting point for controlling cost.
Tell us what you need and we will review the best way to build it together.
Call: +98 930 170 2710 WhatsApp Telegram