Solar Plant Operations Dashboard: Monitoring Output, PR and Fault Detection
Once a solar plant is running, its income depends on steady output. An operations dashboard shows what the plant is producing now, what it should be producing, and where a fault is.
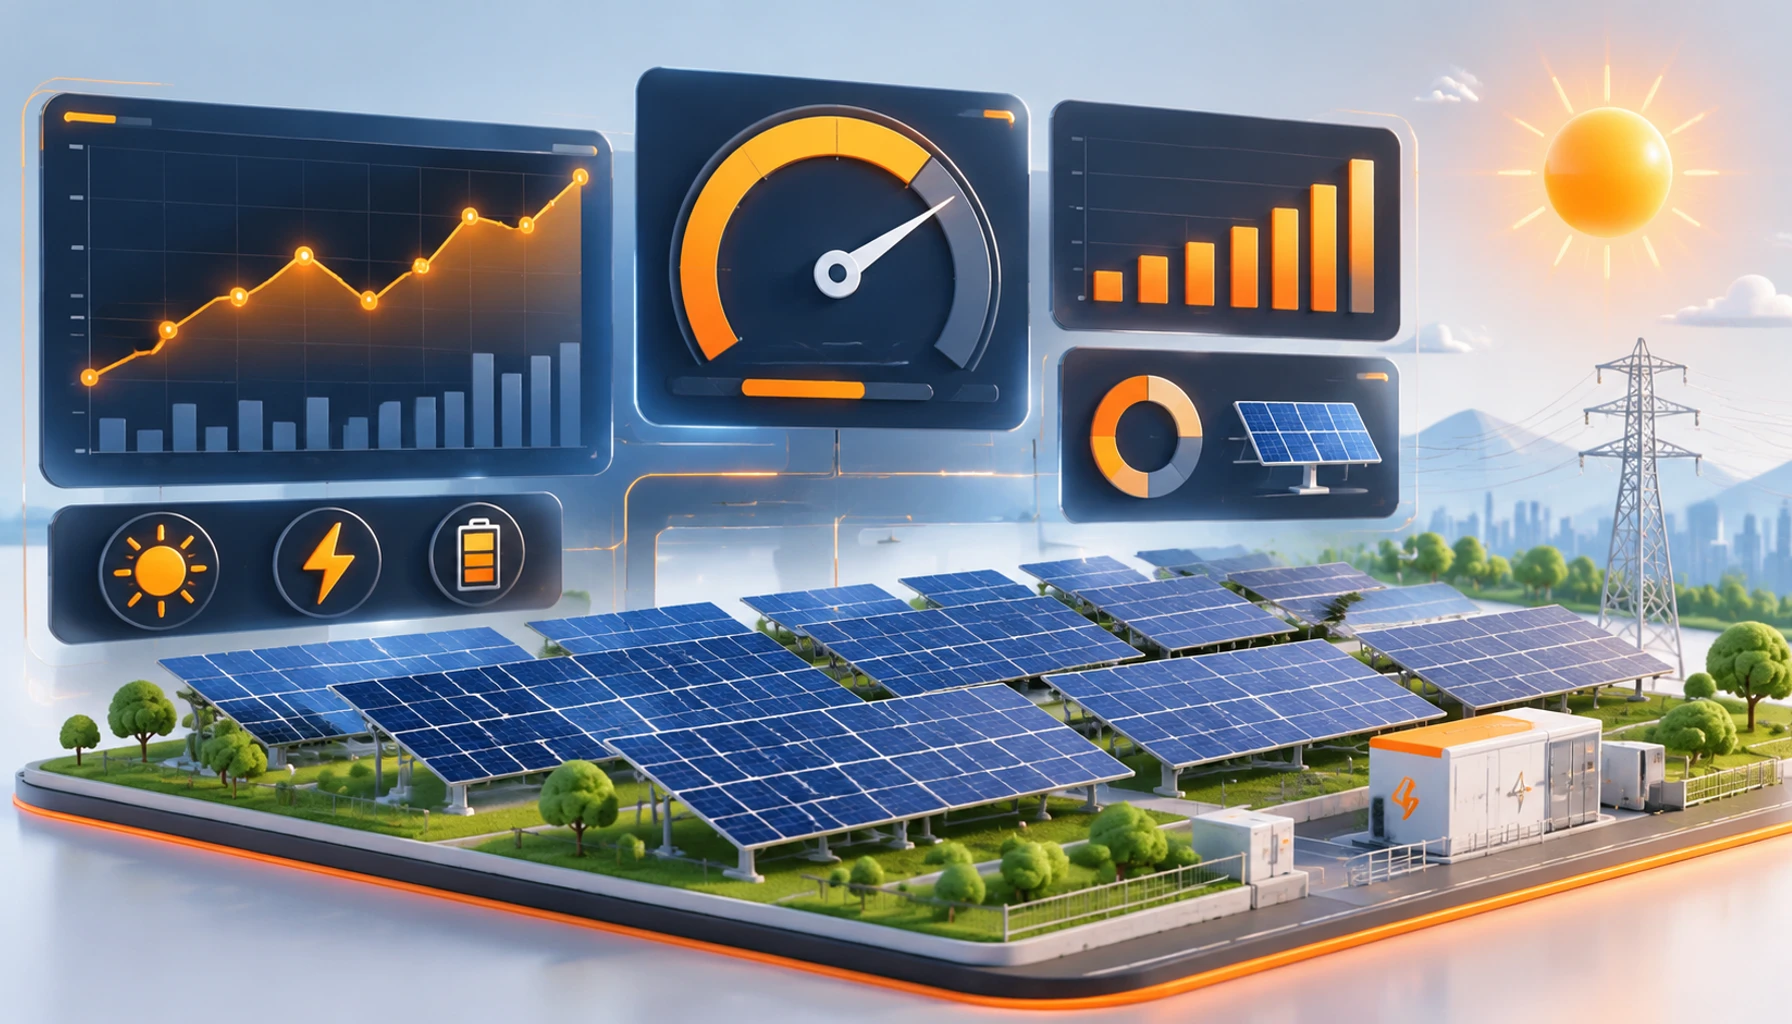
What an operations dashboard shows
It combines data from inverters, meters and weather sensors into one view of plant health, so operators do not have to open each device separately.
Key indicators
- Energy output: live power, daily and monthly energy.
- Specific yield (kWh/kWp): energy divided by installed capacity, which lets you compare plants of different sizes.
- Performance ratio (PR): actual output compared with what the plant could produce given the measured irradiance.
- Irradiance and module temperature: the conditions that explain output.
- Availability: the share of time the plant or each inverter is able to produce.
- Inverter status and alarms.
Detecting faults
Comparing actual output with expected output under the same irradiance reveals problems that a daily total hides: a tripped inverter, a failed string, soiling or shading. Comparing inverters of the same size against each other is a simple and effective check.
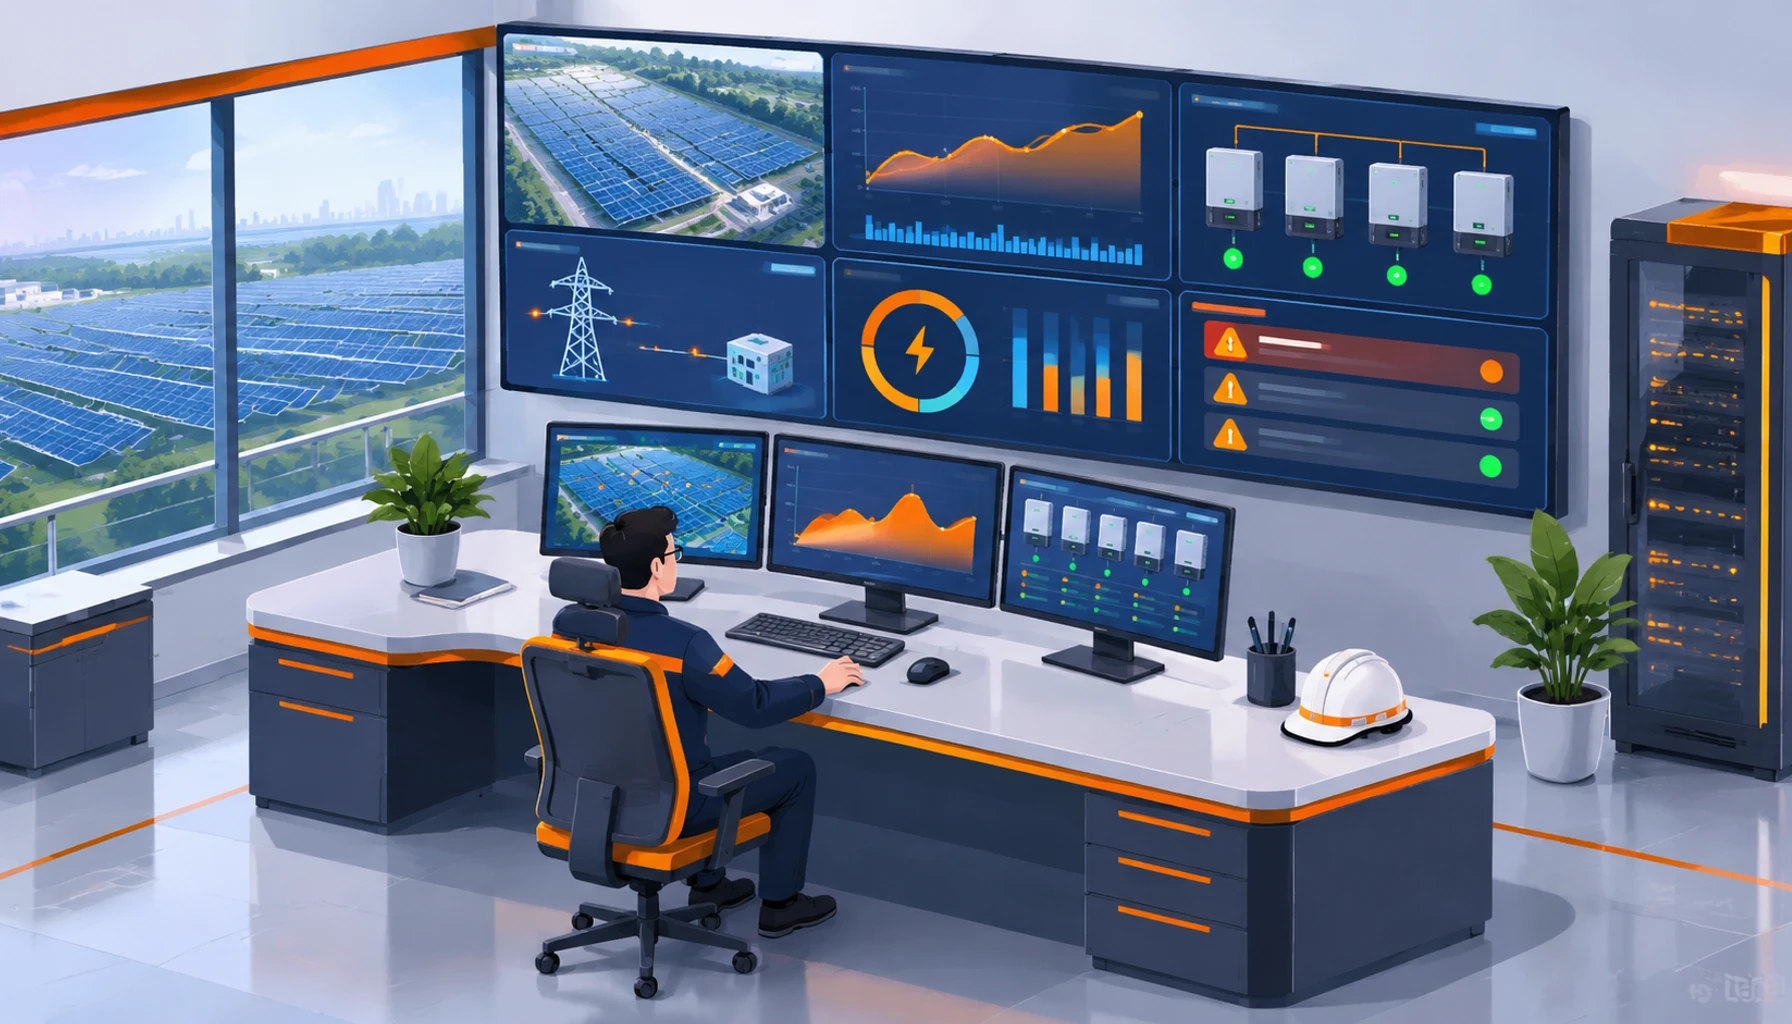
What you need to get started
- Access to inverter or data-logger data (protocol and documentation)
- A pyranometer or other irradiance source
- Defined alarm rules and who receives them
Summary
An operations dashboard does not increase sunlight, but it helps operators notice and fix losses sooner. Whether a particular plant can be connected depends on its equipment and data access, which we check first.
Tell us what you need and we will review the best way to build it together.
Call: +98 930 170 2710 WhatsApp Telegram