What Is a Management Dashboard? A Guide to Building One and Choosing KPIs
A management dashboard is a single screen that shows an organisation's most important indicators at a glance. Its purpose is to replace long reports with a clear picture that helps managers decide faster, based on data.
What exactly is a management dashboard?
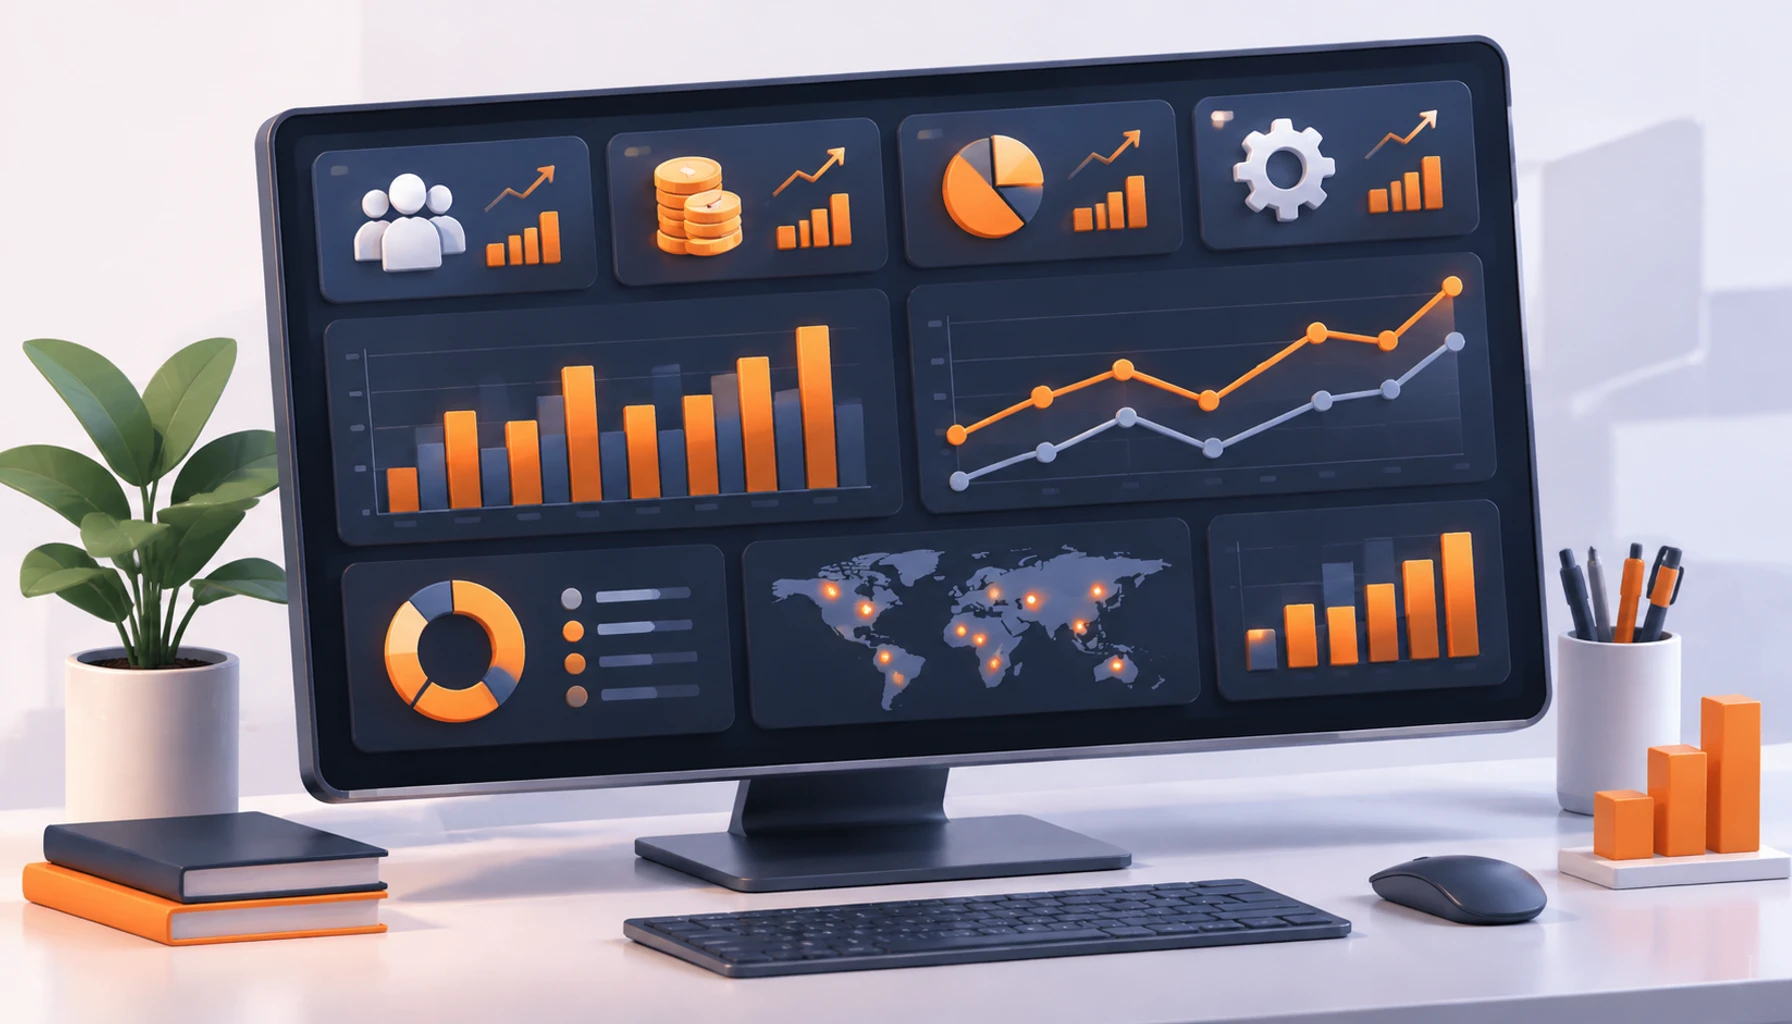
A management dashboard is a set of charts, tables and numeric indicators fed from an organisation's data sources to show the state of the business. A good dashboard does not just "display data"; it answers a management question, for example: "Are we ahead of or behind our sales target this month?"
How a dashboard differs from an Excel report
An Excel report is usually prepared by hand, is already out of date when it is finished, and every person ends up with their own version. A dashboard reads automatically or semi-automatically from the original data source, everyone sees the same picture, and trends are easy to follow.

Which KPIs should a dashboard include?
Indicators depend on the type of business, but for most manufacturing and trading companies these are a good base:
- Sales, orders and average order value
- Gross margin and cost trends
- Cash position, receivables and payables
- Production volume, downtime and defect rate
- Inventory level and turnover
- Leads and conversion rate from marketing
Steps to build a management dashboard
- Define the questions. Start with the decisions the dashboard must support, not with the charts.
- Choose indicators. Keep a small number of KPIs with a clear definition and an owner for each.
- Identify data sources. Excel files, databases, accounting software, or machine and sensor data.
- Clean and connect the data. Agree on one definition for each number.
- Design the screen. Put the most important figures at the top and use trends and comparisons rather than raw tables.
- Test with users and refine. Review it with the managers who will use it and adjust.
Common mistakes when building dashboards
- Showing too many charts, so nothing stands out
- Indicators without a clear definition or owner
- Data that is not refreshed, so people stop trusting it
- Designing for looks instead of for decisions
Summary
A management dashboard turns scattered data into a shared, current view of the business. The key is to start from the decisions you need to make, keep the indicator list short, and make sure the data behind it is reliable.
Tell us what you need and we will review the best way to build it together.
Call: +98 930 170 2710 WhatsApp Telegram